Comparing D2 and Diagrams as cloud architecture diagram drawing tools
 Cloud Architecture using D2
Intro
The solution architect in the cloud often creates architecture diagrams. There are various tools available for drawing diagrams, with services like Draw.io being prominent. These tools allow drawing diagrams through a GUI, but surprisingly, it consumes a significant amount of time. Moreover, different architects may have different patterns for drawing architectures, resulting in variations even for the same architecture.
Recently, the concept of Diagram as Code emerged to address these issues. In fact, this concept has existed for a while but has primarily focused on general diagram creation and was not optimized for cloud architecture. Therefore, there are now code-focused solutions for drawing cloud architectures. One such solution is Diagrams, developed by a Korean developer. This code is open source and has gained some recognition.
However, it seems that the main developer has been busy and hasn’t been updating it for a while. Of course, you could fork the project and continue development, but there is a possibility of maintenance issues unless it is officially archived. (It was actually updated while I was writing this.)
So, while exploring alternatives, you came across the D2 code. D2 has attracted more users and is based on Golang. However, it still has some inconveniences when used for creating cloud architectures. Therefore, you plan to draw the same diagrams with D2 to see if it is suitable as a tool for drawing cloud architecture diagrams.
First Example
The Quick Start for Diagrams includes the following example:
from diagrams import Diagram
from diagrams.aws.compute import EC2
from diagrams.aws.database import RDS
from diagrams.aws.network import ELB

with Diagram("", show=False):
    ELB("lb") >> EC2("web") >> RDS("userdb")
This is a very simple code, but one thing to note here is the use of >> to represent relationships between instances. This is a feature called operator overloading, where existing operator functionality between instance objects is redefined. In Python, >> is the rshift operator.
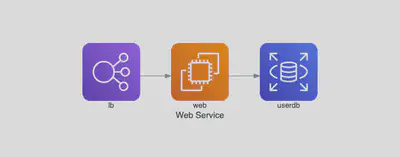
To draw this architecture in D2, you can write it as follows.
direction: right

lb: "lb" {
  shape: image
  icon: https://icon.icepanel.io/AWS/svg/Networking-Content-Delivery/Elastic-Load-Balancing.svg
  width: 100
  height: 100
}

ec2: "web" {
  shape: image
  icon: https://icons.terrastruct.com/aws%2FCompute%2FAmazon-EC2_light-bg.svg
  width: 100
  height: 100
}

db: "db" {
  shape: image
  icon: https://icons.terrastruct.com/aws%2FDatabase%2FAmazon-RDS.svg
  width: 100
  height: 100
}

lb -> ec2 -> db

Since it’s a simple diagram, it can be almost identical. The >> operator is changed to ->. However, in Diagrams, you can easily refer to each item as instance objects, while in D2, there is an inconvenience where you need to specify the shape using image files directly. D2 has Class and Import features, and we will use them to make the following changes.
To draw this architecture in D2, you can write it as follows. Since it’s a simple diagram, it can be almost identical. The >> operator is changed to ->. However, in Diagrams, you can easily refer to each item as instance objects, while in D2, there is an inconvenience where you need to specify the shape using image files directly. D2 has Class and Import features, and we will use them to make the following changes.
First, create a file to serve as the Class, and name it models.d2.
classes:{
lb: {
  shape: image
  icon: https://icons.terrastruct.com/aws%2FNetworking%20&%20Content%20Delivery%2FElastic-Load-Balancing.svg
  width: 100
  height: 100
}

ec2: {
  shape: image
  icon: https://icons.terrastruct.com/aws%2FCompute%2FAmazon-EC2_light-bg.svg
  width: 100
  height: 100
}

db: {
  shape: image
  icon: https://icons.terrastruct.com/aws%2FDatabase%2FAmazon-RDS.svg
  width: 100
  height: 100
}
}
Then, by importing this models file, you can achieve the same result.
direction: right

...@models.d2

lb.class: lb
ec2.class: ec2
ec2.label: web
db.class: db
db.label: events

lb -> ec2 -> db
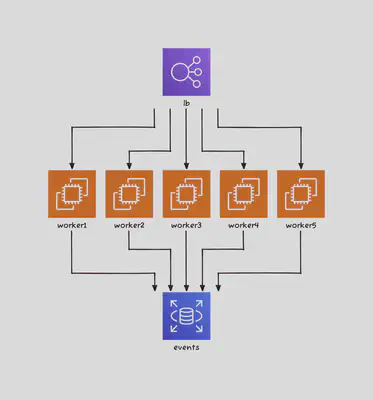
Second Example 두번째 예제
The second example is the first example among the Examples in Diagrams.
Grouped Workers on AWS
  from diagrams import Diagram
  from diagrams.aws.compute import EC2
  from diagrams.aws.database import RDS
  from diagrams.aws.network import ELB

  with Diagram("Grouped Workers", show=False, direction="TB"):
      ELB("lb") >> [EC2("worker1"),
                    EC2("worker2"),
                    EC2("worker3"),
                    EC2("worker4"),
                    EC2("worker5")] >> RDS("events")

Each node represents a Python instance, and you can create these instances as a list and give a single command to connect them all at once. How can you achieve this in D2? Unfortunately, D2 doesn’t have a group feature. There is a concept called Container, which is somewhat similar, but it’s a slightly different concept from grouping, as I will explain in the next example. In D2, you have to write individual connection relationships for each node as shown below.
direction: down

...@models2.d2

lb.class: lb
worker1.class: ec2
worker2.class: ec2
worker3.class: ec2
worker4.class: ec2
worker5.class: ec2
db.class: db
db.label: events

lb -> worker1 -> db
lb -> worker2 -> db
lb -> worker3 -> db
lb -> worker4 -> db
lb -> worker5 -> db
Another feature to explain here is D2’s Layout feature. Layout is an engine that determines how to arrange the diagram. D2 supports three Layout engines: Dagre, ELK, and TALA. If you’re not sure about the concept of Layout, let’s try drawing diagrams and see the results.
The command to extract the diagram in D2 is as follows.
d2 -s -t 302 -l dagre example.d2 example2new_dagre.png
Here, -s indicates that it will be drawn in the sketch version, and -t 302 specifies the theme. Please refer to the official documentation for information about the sketch version and themes. -l is used to specify the layout, and here, Darge is specified. You should list the D2 file and the output file in that order.
First, I tried drawing it using the Dagre version.

I will now draw it using the ELK version.
The first two layouts can be used for free, but the TALA layout requires a paid subscription. However, it seems to be free for evaluation purposes, so it should be fine for the purpose of this blog post.

Which of the three layouts is the best? It may vary depending on personal preference. I won’t provide an objective evaluation, but in my opinion, for this example, the free-to-use ELK method seems better.
Third Example
The third example is the second example among the Examples in Diagrams.
from diagrams import Cluster, Diagram
from diagrams.aws.compute import ECS
from diagrams.aws.database import ElastiCache, RDS
from diagrams.aws.network import ELB
from diagrams.aws.network import Route53

with Diagram("Clustered Web Services", show=False):
    dns = Route53("dns")
    lb = ELB("lb")

    with Cluster("Services"):
        svc_group = [ECS("web1"),
                     ECS("web2"),
                     ECS("web3")]

    with Cluster("DB Cluster"):
        db_primary = RDS("userdb")
        db_primary - [RDS("userdb ro")]

    memcached = ElastiCache("memcached")

    dns >> lb >> svc_group
    svc_group >> db_primary
    svc_group >> memcached

The Cluster function in Diagrams groups multiple nodes and draws them within a single box. Let’s try drawing this in D2. This time, I’ll show you the diagrams first.

This is a similar drawing, but it seems that there are too many arrows cluttering the diagram. In D2, the function to draw within a single box is called Container, and you can connect Containers with nodes. In fact, it’s easier to understand when you see it in the figure.

Depending on what you want to express, it may vary, but personally, I find that drawing it like the latter (Case 2) is neater and better. Diagrams does not yet have a feature to connect nodes to clusters (boxes).
Here’s the code I wrote.
models.d2
classes:{
lb: {
  shape: image
  icon: https://icons.terrastruct.com/aws%2FNetworking%20&%20Content%20Delivery%2FElastic-Load-Balancing.svg
  width: 100
  height: 100
}

ec2: {
  shape: image
  icon: https://icons.terrastruct.com/aws%2FCompute%2FAmazon-EC2_light-bg.svg
  width: 100
  height: 100
}

db: {
  shape: image
  icon: https://icons.terrastruct.com/aws%2FDatabase%2FAmazon-RDS.svg
  width: 100
  height: 100
}

dns: "dns" {
  shape: image
  icon: https://icons.terrastruct.com/aws%2FNetworking%20&%20Content%20Delivery%2FAmazon-Route-53.svg
  width: 100
  height: 100
}

memcached : "memcached" {
  shape: image
  icon: https://icons.terrastruct.com/aws%2FDatabase%2FAmazon-ElastiCache.svg
  width: 100
  height: 100
}

}
direction: right

...@models.d2

dns.class: dns
lb.class: lb
container1.web1.class: ec2
container1.web2.class: ec2
container1.web3.class: ec2
container2.userdb1.class: db
container2.userdb1.label: userdb
container2.userdb2.class: db
container2.userdb2.label: userdb ro
memcached.class: memcached

container1: "Services" {
  web1
  web2
  web3
}

container2: "DB Cluster" {
  userdb1
  userdb2
}

dns -> lb
lb -> container1
container1 -> container2
container1 -> memcached

container2.userdb1 -- container2.userdb2
Conclusion
I have compared Diagrams and D2 from the perspective of drawing cloud architectures. In reality, both of these codes are still not as user-friendly for creating visually appealing diagrams as direct drawing tools like Draw.io.
However, if the need for Diagrams as Code continues to grow, both of these codes could prove to be valuable. It seems that further development is needed for both codes, but the fact that D2 is actively developed by Terrastruct is an advantage for D2.
One advantage of Diagrams is that it is written in Python, making it suitable for integrating with other Python code for additional development. D2 also offers some capabilities for using it as a library in Golang, but it currently does not support as many features.
I will keep an eye on how both of these codes evolve in the future.
- Reference
- D2 Repository: https://github.com/terrastruct/d2
- D2 Official site: https://d2lang.com
- Diagrams Repository: https://github.com/mingrammer/diagrams
- Diagrams Official site: https://diagrams.mingrammer.com